Delta Volume Columns Pro [LucF]█ OVERVIEW
This indicator displays volume delta information calculated with intrabar inspection on historical bars, and feed updates when running in realtime. It is designed to run in a pane and can display either stacked buy/sell volume columns or a signal line which can be calculated and displayed in many different ways.
Five different models are offered to reveal different characteristics of the calculated volume delta information. Many options are offered to visualize the calculations, giving you much leeway in morphing the indicator's visuals to suit your needs. If you value delta volume information, I hope you will find the time required to master Delta Volume Columns Pro well worth the investment. I am confident that if you combine a proper understanding of the indicator's information with an intimate knowledge of the volume idiosyncrasies on the markets you trade, you can extract useful market intelligence using this tool.
█ WARNINGS
1. The indicator only works on markets where volume information is available,
Please validate that your symbol's feed carries volume information before asking me why the indicator doesn't plot values.
2. When you refresh your chart or re-execute the script on the chart, the indicator will repaint because elapsed realtime bars will then recalculate as historical bars.
3. Because the indicator uses different modes of calculation on historical and realtime bars, it's critical that you understand the differences between them. Details are provided further down.
4. Calculations using intrabar inspection on historical bars can only be done from some chart timeframes. See further down for a list of supported timeframes.
If the chart's timeframe is not supported, no historical volume delta will display.
█ CONCEPTS
Chart bars
Three different types of bars are used in charts:
1. Historical bars are bars that have already closed when the script executes on them.
2. The realtime bar is the current, incomplete bar where a script is running on an open market. There is only one active realtime bar on your chart at any given time.
The realtime bar is where alerts trigger.
3. Elapsed realtime bars are bars that were calculated when they were realtime bars but have since closed.
When a script re-executes on a chart because the browser tab is refreshed or some of its inputs are changed, elapsed realtime bars are recalculated as historical bars.
Why does this indicator use two modes of calculation?
Historical bars on TradingView charts contain OHLCV data only, which is insufficient to calculate volume delta on them with any level of precision. To mine more detailed information from those bars we look at intrabars , i.e., bars from a smaller timeframe (we call it the intrabar timeframe ) that are contained in one chart bar. If your chart Is running at 1D on a 24x7 market for example, most 1D chart bars will contain 24 underlying 1H bars in their dilation. On historical bars, this indicator looks at those intrabars to amass volume delta information. If the intrabar is up, its volume goes in the Buy bin, and inversely for the Sell bin. When price does not move on an intrabar, the polarity of the last known movement is used to determine in which bin its volume goes.
In realtime, we have access to price and volume change for each update of the chart. Because a 1D chart bar can be updated tens of thousands of times during the day, volume delta calculations on those updates is much more precise. This precision, however, comes at a price:
— The script must be running on the chart for it to keep calculating in realtime.
— If you refresh your chart you will lose all accumulated realtime calculations on elapsed realtime bars, and the realtime bar.
Elapsed realtime bars will recalculate as historical bars, i.e., using intrabar inspection, and the realtime bar's calculations will reset.
When the script recalculates elapsed realtime bars as historical bars, the values on those bars will change, which means the script repaints in those conditions.
— When the indicator first calculates on a chart containing an incomplete realtime bar, it will count ALL the existing volume on the bar as Buy or Sell volume,
depending on the polarity of the bar at that point. This will skew calculations for that first bar. Scripts have no access to the history of a realtime bar's previous updates,
and intrabar inspection cannot be used on realtime bars, so this is the only to go about this.
— Even if alerts only trigger upon confirmation of their conditions after the realtime bar closes, they are repainting alerts
because they would perhaps not have calculated the same way using intrabar inspection.
— On markets like stocks that often have different EOD and intraday feeds and volume information,
the volume's scale may not be the same for the realtime bar if your chart is at 1D, for example,
and the indicator is using an intraday timeframe to calculate on historical bars.
— Any chart timeframe can be used in realtime mode, but plots that include moving averages in their calculations may require many elapsed realtime bars before they can calculate.
You might prefer drastically reducing the periods of the moving averages, or using the volume columns mode, which displays instant values, instead of the line.
Volume Delta Balances
This indicator uses a variety of methods to evaluate five volume delta balances and derive other values from those balances. The five balances are:
1 — On Bar Balance : This is the only balance using instant values; it is simply the subtraction of the Sell volume from the Buy volume on the bar.
2 — Average Balance : Calculates a distinct EMA for both the Buy and Sell volumes, and subtracts the Sell EMA from the Buy EMA.
3 — Momentum Balance : Starts by calculating, separately for both Buy and Sell volumes, the difference between the same EMAs used in "Average Balance" and
an SMA of double the period used for the "Average Balance" EMAs. The difference for the Sell side is subtracted from the difference for the Buy side,
and an RSI of that value is calculated and brought over the −50/+50 scale.
4 — Relative Balance : The reference values used in the calculation are the Buy and Sell EMAs used in the "Average Balance".
From those, we calculate two intermediate values using how much the instant Buy and Sell volumes on the bar exceed their respective EMA — but with a twist.
If the bar's Buy volume does not exceed the EMA of Buy volume, a zero value is used. The same goes for the Sell volume with the EMA of Sell volume.
Once we have our two intermediate values for the Buy and Sell volumes exceeding their respective MA, we subtract them. The final "Relative Balance" value is an ALMA of that subtraction.
The rationale behind using zero values when the bar's Buy/Sell volume does not exceed its EMA is to only take into account the more significant volume.
If both instant volume values exceed their MA, then the difference between the two is the signal's value.
The signal is called "relative" because the intermediate values are the difference between the instant Buy/Sell volumes and their respective MA.
This balance flatlines when the bar's Buy/Sell volumes do not exceed their EMAs, which makes it useful to spot areas where trader interest dwindles, such as consolidations.
The smaller the period of the final value's ALMA, the more easily you will see the balance flatline. These flat zones should be considered no-trade zones.
5 — Percent Balance : This balance is the ALMA of the ratio of the "On Bar Balance" value, i.e., the volume delta balance on the bar (which can be positive or negative),
over the total volume for that bar.
From the balances and marker conditions, two more values are calculated:
1 — Marker Bias : It sums the up/down (+1/‒1) occurrences of the markers 1 to 4 over a period you define, so it ranges from −4 to +4, times the period.
Its calculation will depend on the modes used to calculate markers 3 and 4.
2 — Combined Balances : This is the sum of the bull/bear (+1/−1) states of each of the five balances, so it ranges from −5 to +5.
█ FEATURES
The indicator has two main modes of operation: Columns and Line .
Columns
• In Columns mode you can display stacked Buy/Sell volume columns.
• The buy section always appears above the centerline, the sell section below.
• The top and bottom sections can be colored independently using eight different methods.
• The EMAs of the Buy/Sell values can be displayed (these are the same EMAs used to calculate the "Average Balance").
Line
• Displays one of seven signals: the five balances or one of two complementary values, i.e., the "Marker Bias" or the "Combined Balances".
• You can color the line and its fill using independent calculation modes to pack more information in the display.
You can thus appraise the state of 3 different values using the line itself, its color and the color of its fill.
• A "Divergence Levels" feature will use the line to automatically draw expanding levels on divergence events.
Default settings
Using the indicator's default settings, this is the information displayed:
• The line is calculated on the "Average Balance".
• The line's color is determined by the bull/bear state of the "Percent Balance".
• The line's fill gradient is determined by the advances/declines of the "Momentum Balance".
• The orange divergence dots are calculated using discrepancies between the polarity of the "On Bar Balance" and the chart's bar.
• The divergence levels are determined using the line's level when a divergence occurs.
• The background's fill gradient is calculated on advances/declines of the "Marker Bias".
• The chart bars are colored using advances/declines of the "Relative Balance". Divergences are shown in orange.
• The intrabar timeframe is automatically determined from the chart's timeframe so that a minimum of 50 intrabars are used to calculate volume delta on historical bars.
Alerts
The configuration of the marker conditions explained further is what determines the conditions that will trigger alerts created from this script. Note that simply selecting the display of markers does not create alerts. To create an alert on this script, you must use ALT-A from the chart. You can create multiple alerts triggering on different conditions from this same script; simply configure the markers so they define the trigger conditions for each alert before creating the alert. The configuration of the script's inputs is saved with the alert, so from then on you can change them without affecting the alert. Alert messages will mention the marker(s) that triggered the specific alert event. Keep in mind, when creating alerts on small chart timeframes, that discrepancies between alert triggers and markers displayed on your chart are to be expected. This is because the alert and your chart are running two distinct instances of the indicator on different servers and different feeds. Also keep in mind that while alerts only trigger on confirmed conditions, they are calculated using realtime calculation mode, which entails that if you refresh your chart and elapsed realtime bars recalculate as historical bars using intrabar inspection, markers will not appear in the same places they appeared in realtime. So it's important to understand that even though the alert conditions are confirmed when they trigger, these alerts will repaint.
Let's go through the sections of the script's inputs.
Columns
The size of the Buy/Sell columns always represents their respective importance on the bar, but the coloring mode for tops and bottoms is independent. The default setup uses a standard coloring mode where the Buy/Sell columns are always in the bull/bear color with a higher intensity for the winning side. Seven other coloring modes allow you to pack more information in the columns. When choosing to color the top columns using a bull/bear gradient on "Average Balance", for example, you will have bull/bear colored tops. In order for the color of the bottom columns to continue to show the instant bar balance, you can then choose the "On Bar Balance — Dual Solid Colors" coloring mode to make those bars the color of the winning side for that bar. You can display the averages of the Buy and Sell columns. If you do, its coloring is controlled through the "Line" and "Line fill" sections below.
Line and Line fill
You can select the calculation mode and the thickness of the line, and independent calculations to determine the line's color and fill.
Zero Line
The zero line can display dots when all five balances are bull/bear.
Divergences
You first select the detection mode. Divergences occur whenever the up/down direction of the signal does not match the up/down polarity of the bar. Divergences are used in three components of the indicator's visuals: the orange dot, colored chart bars, and to calculate the divergence levels on the line. The divergence levels are dynamic levels that automatically build from the line's values on divergence events. On consecutive divergences, the levels will expand, creating a channel. This implementation of the divergence levels corresponds to my view that divergences indicate anomalies, hesitations, points of uncertainty if you will. It precludes any attempt to identify a directional bias to divergences. Accordingly, the levels merely take note of divergence events and mark those points in time with levels. Traders then have a reference point from which they can evaluate further movement. The bull/bear/neutral colors used to plot the levels are also congruent with this view in that they are determined by the line's position relative to the levels, which is how I think divergences can be put to the most effective use. One of the coloring modes for the line's fill uses advances/declines in the line after divergence events.
Background
The background can show a bull/bear gradient on six different calculations. As with other gradients, you can adjust its brightness to make its importance proportional to how you use it in your analysis.
Chart bars
Chart bars can be colored using seven different methods. You have the option of emptying the body of bars where volume does not increase, as does my TLD indicator, and you can choose whether you want to show divergences.
Intrabar Timeframe
This is the intrabar timeframe that will be used to calculate volume delta using intrabar inspection on historical bars. You can choose between four modes. The three "Auto-steps" modes calculate, from the chart's timeframe, the intrabar timeframe where the said number of intrabars will make up the dilation of chart bars. Adjustments are made for non-24x7 markets. "Fixed" mode allows you to select the intrabar timeframe you want. Checking the "Show TF" box will display in the lower-right corner the intrabar timeframe used at any given moment. The proper selection of the intrabar timeframe is important. It must achieve maximal granularity to produce precise results while not unduly slowing down calculations, or worse, causing runtime errors. Note that historical depth will vary with the intrabar timeframe. The smaller the timeframe, the shallower historical plots you will be.
Markers
Markers appear when the required condition has been confirmed on a closed bar. The configuration of the markers when you create an alert is what determines when the alert will trigger. Five markers are available:
• Balances Agreement : All five balances are either bullish or bearish.
• Double Bumps : A double bump is two consecutive up/down bars with +/‒ volume delta, and rising Buy/Sell volume above its average.
• Divergence confirmations : A divergence is confirmed up/down when the chosen balance is up/down on the previous bar when that bar was down/up, and this bar is up/down.
• Balance Shifts : These are bull/bear transitions of the selected signal.
• Marker Bias Shifts : Marker bias shifts occur when it crosses into bull/bear territory.
Periods
Allows control over the periods of the different moving averages used to calculate the balances.
Volume Discrepancies
Stock exchanges do not report the same volume for intraday and daily (or higher) resolutions. Other variations in how volume information is reported can also occur in other markets, namely Forex, where volume irregularities can even occur between different intraday timeframes. This will cause discrepancies between the total volume on the bar at the chart's timeframe, and the total volume calculated by adding the volume of the intrabars in that bar's dilation. This does not necessarily invalidate the volume delta information calculated from intrabars, but it tells us that we are using partial volume data. A mechanism to detect chart vs intrabar timeframe volume discrepancies is provided. It allows you to define a threshold percentage above which the background will indicate a difference has been detected.
Other Settings
You can control here the display of the gray dot reminder on realtime bars, and the display of error messages if you are using a chart timeframe that is not greater than the fixed intrabar timeframe, when you use that mode. Disabling the message can be useful if you only use realtime mode at chart timeframes that do not support intrabar inspection.
█ RAMBLINGS
On Volume Delta
Volume is arguably the best complement to interpret price action, and I consider volume delta to be the most effective way of processing volume information. In periods of low-volatility price consolidations, volume will typically also be lower than normal, but slight imbalances in the trend of the buy/sell volume balance can sometimes help put early odds on the direction of the break from consolidation. Additionally, the progression of the volume imbalance can help determine the proximity of the breakout. I also find volume delta and the number of divergences very useful to evaluate the strength of trends. In trends, I am looking for "slow and steady", i.e., relatively low volatility and pauses where price action doesn't look like world affairs are being reassessed. In my personal mythology, this type of trend is often more resilient than high-volatility breakouts, especially when volume balance confirms the general agreement of traders signaled by the low-volatility usually accompanying this type of trend. The volume action on pauses will often help me decide between aggressively taking profits, tightening a stop or going for a longer-term movement. As for reversals, they generally occur in high-volatility areas where entering trades is more expensive and riskier. While the identification of counter-trend reversals fascinates many traders to no end, they represent poor opportunities in my view. Volume imbalances often precede reversals, but I prefer to use volume delta information to identify the areas following reversals where I can confirm them and make relatively low-cost entries with better odds.
On "Buy/Sell" Volume
Buying or selling volume are misnomers, as every unit of volume transacted is both bought and sold by two different traders. While this does not keep me from using the terms, there is no such thing as “buy only” or “sell only” volume. Trader lingo is riddled with peculiarities.
Divergences
The divergence detection method used here relies on a difference between the direction of a signal and the polarity (up/down) of a chart bar. When using the default "On Bar Balance" to detect divergences, however, only the bar's volume delta is used. You may wonder how there can be divergences between buying/selling volume information and price movement on one bar. This will sometimes be due to the calculation's shortcomings, but divergences may also occur in instances where because of order book structure, it takes less volume to increase the price of an asset than it takes to decrease it. As usual, divergences are points of interest because they reveal imbalances, which may or may not become turning points. To your pattern-hungry brain, the divergences displayed by this indicator will — as they do on other indicators — appear to often indicate turnarounds. My opinion is that reality is generally quite sobering and I have no reliable information that would tend to prove otherwise. Exercise caution when using them. Consequently, I do not share the overwhelming enthusiasm of traders in identifying bullish/bearish divergences. For me, the best course of action when a divergence occurs is to wait and see what happens from there. That is the rationale underlying how my divergence levels work; they take note of a signal's level when a divergence occurs, and it's the signal's behavior from that point on that determines if the post-divergence action is bullish/bearish.
Superfluity
In "The Bed of Procrustes", Nassim Nicholas Taleb writes: To bankrupt a fool, give him information . This indicator can display lots of information. While learning to use a new indicator inevitably requires an adaptation period where we put it through its paces and try out all its options, once you have become used to it and decide to adopt it, rigorously eliminate the components you don't use and configure the remaining ones so their visual prominence reflects their relative importance in your analysis. I tried to provide flexible options for traders to control this indicator's visuals for that exact reason — not for window dressing.
█ LIMITATIONS
• This script uses a special characteristic of the `security()` function allowing the inspection of intrabars — which is not officially supported by TradingView.
It has the advantage of permitting a more robust calculation of volume delta than other methods on historical bars, but also has its limits.
• Intrabar inspection only works on some chart timeframes: 3, 5, 10, 15 and 30 minutes, 1, 2, 3, 4, 6, and 12 hours, 1 day, 1 week and 1 month.
The script’s code can be modified to run on other resolutions.
• When the difference between the chart’s timeframe and the intrabar timeframe is too great, runtime errors will occur. The Auto-Steps selection mechanisms should avoid this.
• All volume is not created equally. Its source, components, quality and reliability will vary considerably with sectors and instruments.
The higher the quality, the more reliably volume delta information can be used to guide your decisions.
You should make it your responsibility to understand the volume information provided in the data feeds you use. It will help you make the most of volume delta.
█ NOTES
For traders
• The Data Window shows key values for the indicator.
• While this indicator displays some of the same information calculated in my Delta Volume Columns ,
I have elected to make it a separate publication so that traders continue to have a simpler alternative available to them. Both code bases will continue to evolve separately.
• All gradients used in this indicator determine their brightness intensities using advances/declines in the signal—not their relative position in a pre-determined scale.
• Volume delta being relative, by nature, it is particularly well-suited to Forex markets, as it filters out quite elegantly the cyclical volume data characterizing the sector.
If you are interested in volume delta, consider having a look at my other "Delta Volume" indicators:
• Delta Volume Realtime Action displays realtime volume delta and tick information on the chart.
• Delta Volume Candles builds volume delta candles on the chart.
• Delta Volume Columns is a simpler version of this indicator.
For coders
• I use the `f_c_gradientRelativePro()` from the PineCoders Color Gradient Framework to build my gradients.
This function has the advantage of allowing begin/end colors for both the bull and bear colors. It also allows us to define the number of steps allowed for each gradient.
I use this to modulate the gradients so they perform optimally on the combination of the signal used to calculate advances/declines,
but also the nature of the visual component the gradient applies to. I use fewer steps for choppy signals and when the gradient is used on discrete visual components
such as volume columns or chart bars.
• I use the PineCoders Coding Conventions for Pine to write my scripts.
• I used functions modified from the PineCoders MTF Selection Framework for the selection of timeframes.
█ THANKS TO:
— The devs from TradingView's Pine and other teams, and the PineCoders who collaborate with them. They are doing amazing work,
and much of what this indicator does could not be done without their recent improvements to Pine.
— A guy called Kuan who commented on a Backtest Rookies presentation of their Volume Profile indicator using a `for` loop.
This indicator started from the intrabar inspection technique illustrated in Kuan's snippet.
— theheirophant , my partner in the exploration of the sometimes weird abysses of `security()`’s behavior at intrabar timeframes.
— midtownsk8rguy , my brilliant companion in mining the depths of Pine graphics.
Cari dalam skrip untuk "buy sell"

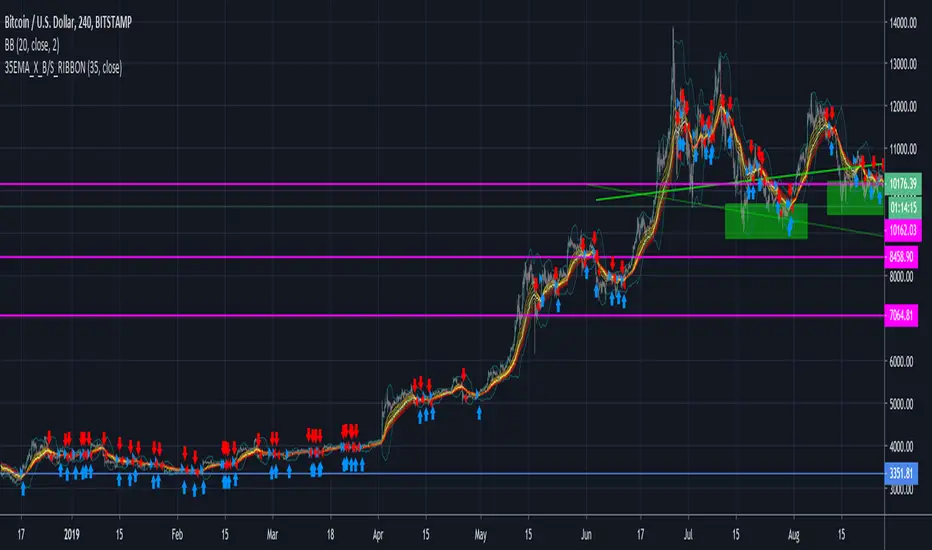
35EMA Cross BuyAndSell Strategy + RIBBON [d3nv3r]This strategy allow the user to move the EMA which control the Buy&Sell Strategy and show the EMA ribbon that can be found in the Template area.
Buy showing the ribbon and letting the user to adjust the EMA signaling the B&S strat the user can create an elaborated strategy for buyPoint and sellPoint.
The 35EMA Cross is choosen by default but I recommend to move it to find best Sell point and best Buy point as you would not react on the same EMA for a Buy signal and a Sell Signal..
It would be good to have buy signal on a EMA and the sell signal on another but that's for another Strategy to be shared.
Let me know by commenting what you would like for the next one !
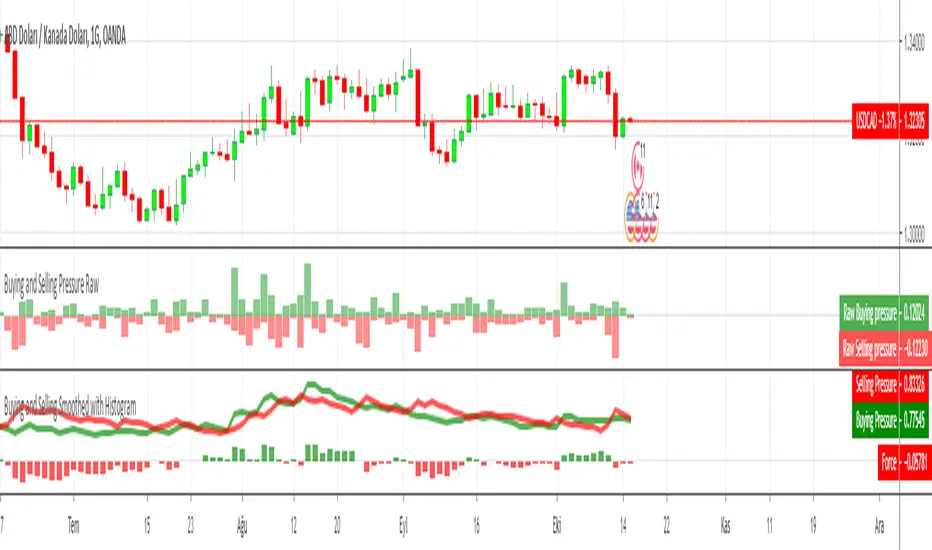
Buying and Selling Pressure RawBuying and Selling Pressure Raw
Raw Buying and selling pressure Indicator. The Raw buying and selling indication is provided in terms of a Columns.
Green bars above zero show the buying pressure and the red bars below the zero line show the selling pressure.
This presents a good visual representation of the dominating pressure.
Delta Volume Columns [LucF]Displays delta volume columns using intrabar volume information. Each volume column is divided into three sections: buying, selling and neutral volume. Volume for each section is determined from the volume and price movement of each intrabar at a user-selected lower resolution.
Features include:
- Choice of color themes for either dark or light chart backgrounds
- Delta volume columns
- Volume Balance displayed as the difference between the MAs of buying and selling volume
- Display of divergences between a bar’s volume balance and the bar’s price movement (example: buying volume > selling volume but close < open). Divergences can be shown in 2 different color schemes (including green/red showing a tentative direction), on volume columns and/or on chart bars
- Display of bar by bar volume balance with highlighting of above average volume
- Display of the usual total volume MA
- Choice of the lower resolution used to retrieve intrabar information
- Alerts configurable on any combination of the markers, with control over long/short direction
- Choice of 3 different markers:
1. Double bumps: two consecutive bars where buying or selling volume is in the same direction and where volume > volume MA
2. Divergence confirmations: direction of the price bar following a price/volume balance divergence
3. Volume balance shifts: zero level crossings of the volume balance MA delta
The chart shows the two main modes of display:
- Top pane : shows the stacked volume columns with divergences in orange and the flattened volume balance MAs delta at the bottom of the volume columns. This volume balance is the same shown in the bottom pane. The top pane also shows the instant volume balance strip above the volume columns. The strip’s colors show which of the buying or selling volume was greater, and colors are brighter if the total volume was above the total volume MA.
- Bottom pane : shows the volume balance MAs delta with markers 1 and 2. Given that this graphic has no price momentum component, I find quite eerie how it often looks like a momentum-based signal.
The default 5 minute intrabar resolution is used in combination with the weekly chart, which is excessive.
This script uses a special characteristic of the security() function’s behavior when it is sent to a resolution lower than the chart’s resolution. Details are given in the script’s comments. This method has the advantage of working under more circumstances than some of the other loop-based methods, but it also has its limits.
IMPORTANT
This is what you need to know:
- The method used does not work on the realtime bar—only on historical bars. Consequently, the volume column shown on the realtime bar is a normal volume column plotted in green or red, following price movement. The column will only show delta volume information after it closes and becomes a historical bar.
- The indicator only works on some chart resolutions: 5, 10, 15 and 30 minutes, 1, 2, 4, 6, and 12 hours, 1 day, 1 week and 1 month. The script’s code can be modified to run on other resolutions, but chart resolutions must be divisible by the lower resolution used for intrabars.
- Intrabar resolutions can be selected from 1, 5, 15, 30, 45 minutes, 1, 2, 3, 4 hours, 1 day, 1 week and 1 month. The intrabar resolution must of course be smaller than the chart’s resolution.
- Contrary to my other indicators where alerts must be configured to trigger “Once Per Bar Close” in order to avoid false triggers (or repainting), all this indicator’s alerts are designed to trigger using previous bar information since the indicator’s calculations in the realtime bar are not exact. Markers are not plotted with a negative offset; they appear at the beginning of the realtime bar following confirmation of the marker’s condition on the previous bar. Alerts for this indicator should thus be configured to trigger “Once Per Bar” so they trigger at the beginning of the realtime bar. Note that the penalty is not that great, as it is simply the instant between the close of the previous realtime bar and the opening of the next. The advantage of using this technique is that the indicator does not repaint; a marker that appears at the beginning of the realtime bar will never disappear.
- The script only plots information that is reliable in the realtime bar, i.e., total volume and markers. All other plots are set to n/a to prevent misleading traders.
- When the difference between the chart’s resolution and the lower resolution is too important, volume columns will not calculate for all bars in the dataset.
On Delta Volume
Buying or selling volume are misnomers, as every unit of volume transacted is both bought and sold by 2 different traders. There is no such thing as “buy only” or “sell only” volume, but trader lingo is riddled with original fabulations.
Without access to order book information, traders work with the assumption that when price moves up during a bar, there was more buying pressure than selling pressure. The built-in volume indicator available on TradingView uses this logic to color the volume columns green or red. While this script’s numbers are more precise because it analyses a number of intrabars to calculate its information, it uses the exact same imperfect logic to calculate its buying/selling/neutral sections.
Until Pine scripts can have access to how much volume was transacted at the bid/ask prices, our so-called buying/selling volume information will always be a mere proxy.
Divergences
You may wonder how there can be divergences between buying/selling volume information and price movement. This will sometimes be due to the methodology’s shortcomings we have just discussed, but divergences may also occur in instances where because of order book structure, it takes less volume to increase the price of an asset than it takes to decrease it.
As usual, divergences are points of interest because they reveal imbalances, which may or may not become turning points. I do not share the overwhelming enthusiasm traders have for divergences. To your pattern-hungry brain, the orange bars this indicator shows on chart will—as divergences on other indicators do–appear to often indicate turnarounds. My opinion is that reality is generally quite sobering, as many who have tried building automated rules based on divergences will tell you. I do not have hard numbers on the lack of performance of divergences—only many failed attempts to make them perform, which a few experienced strategy modelers I know share with me. Please don’t try to read too much into them. While they look great on past data, I find they are often difficult to use in realtime to make bets with good odds.
Thanks to:
- A guy called Kuan who commented on a Backtest Rookies presentation of an intrabar delta volume indicator using a for loop. The heart of “my” indicator is code borrowed from Kuan; I just built a hopefully useful wrapper around it.
- @theheirophant, my partner in the exploration of the sometimes weird abysses of security() ’s behavior at lower resolutions.

Consensio With SignalsUsing the ideas from "Consensio" system, by Tyler Jenks, this Indicator shows a Buy and sell values, with 3 levels
using the position order of 3 smas: short, medium and large
There are 3 combinations indicating buy and 3 indicating sell:
Example: LSM (Long SMA Top, Then Short, Then Medium)
3 levels each. More level more power signal for buy or sell
MLS = Sell Level 1
LSM = Sell Level 2
LMS = Sell Level 3
SLM = Buy Level 1
SML = Buy Level 3
MSL = Buy Level 2
The triangles on top of the indicator shows any cross of the 3 SMAs and the level of buy/sell signal of the combination

Consensio HystogramUsing the ideas from "Consensio" system, by Tyler Jenks, this Indicator shows a Buy and sell values, with 3 levels
using the position order of 3 smas: short, medium and large
There are 3 combinations indicating buy and 3 indicating sell:
Example: LSM (Long SMA Top, Then Short, Then Medium)
3 levels each. More level more power signal for buy or sell
MLS = Sell Level 1
LSM = Sell Level 2
LMS = Sell Level 3
SLM = Buy Level 1
SML = Buy Level 3
MSL = Buy Level 2
The triangles on top of the indicator shows any cross of the 3 SMAs and the level of buy/sell signal of the combination
The hystogram shows a composed value, using the distance of each SMA to the close price of each bar and te result is
multiplied by the actual combination order of the SMAs, positive values for Buy, negative for shell, using values from 1 to 3
The longer the SMA period, more weight has in the result value.
(These factors are editables)
My defaults:
50% using Long SMA
35% Using Medium SMA
15% Using Short SMA
Let me know if you encounter this as useful as me.
Nakitxu

Multiple MACD RSI simple strategySimple strategy script I've had for a while but looks like I never published.
Although it is one of my most simple it seems to have the best profitability. It is pretty rough though. the Stoch RSI has only a little weight to the trade trigger. I'll refine it more over time or you can by all means. Basically the Stoch RSI current K line has to be OVER 40 to trigger a SELL. It has no effect on buy side.
The triggers are roughly as follows:
Year - since so many assets have gone 2x, 3x, 10x+ since 2013 having a strategy that earns a 500% return from 2013 to now isn't that good if buy-and-holding would have got you 800%. This eliminates some of that noise and makes it a little easier to quickly gauge success. So buy/sell trigger need a value of greater or equal to 2018 (default)
MACD 1 - First MACD (short) needs to indicate greater than 0 to buy or less than 0 to sell.
MACD 2 - Same as MACD1 but for second MACD set (long)
Uptrend - Latest close + high divided by last periods close + high needs to be grater than 1. So if latest is 34.30 close and 34.60 high and previous interval is 34.80 close and 34.82 high, that is 0.99 and will not trigger a buy trade.
Downtrend - Same thing but close + low and less than 1.
This script/strategy is pretty rough but if there is interest I'll polish it more since it is a pretty solid but simple strategy for most assets.

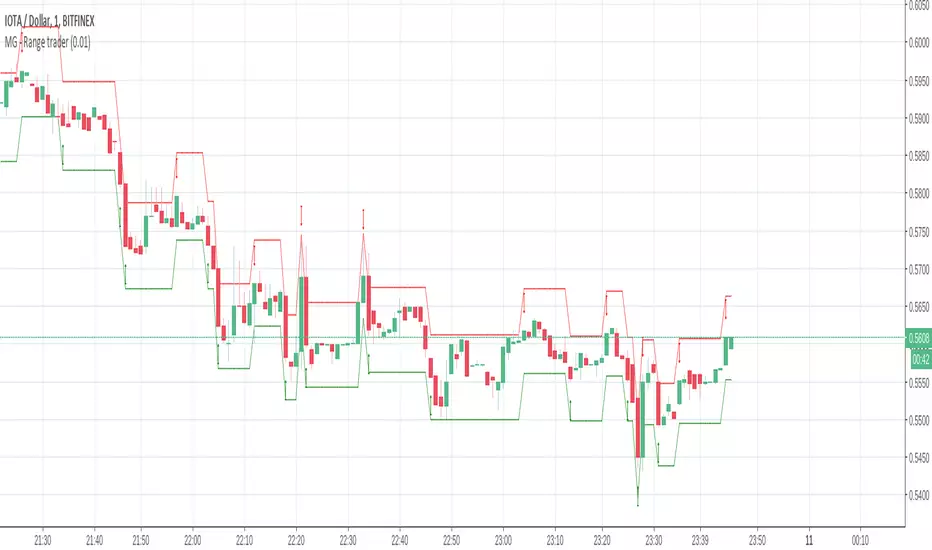
MG - Range trader - 1.0This one is a bit of an experiment..
The theory is, if you have an asset that you firmly believe will rise in the future for fundamental reasons and are happy to hold until that happens i.e. a be a position trader, you can take advantage of market volatility at the same time in a relatively safe way, so theoretically, you profit when the price goes up or down
E.g. You have $1000, an asset in which you want to become a position trader and you are happy to either make more money or more of the asset as you believe that will make you more money in the future, you could wait until a decent retracement, maybe around a good support level, then buy $500 of the asset and simply sell if it goes up by X, buy if it goes down by X. If you keep doing this, you will end up with either with more of the asset or more money. You have a sure gain either way (if you are happy to have either money or asset)
There are some considerations:
The higher the trade size, the faster profit compounds and the faster you exhaust your available buys and sells
- E.g. If asset is $100, you have $500 and you plan to buy / sell every $10 change, if the asset drops straight to $40, your last buy will be at $50, at which point, the asset is still dropping. But it you only plan to buy / sell $5 every $10 price, you will be able to buy right down to 0.
In times of strong trend, it may be better to avoid this approach altogether as there may not be so much oscillation or at least to use a small if not minimum order size.
Application:
The buy and sell triggers can be connected using autoview to convert this indicator into a range trading bot
oenbot BB Buying OpportunitiesThis is my first attempt to emulate the eonbot BB strategy (github.com).
Definitely a beta version, need to work out why false positives, and stop buy/sells after previous buy/sell.
In the wiki page example of eonbot it refers to 75%, in this script enter the converse ... 25% and it should plot accurately.
If you are not familiar with eonbot check out the wiki & github sites : github.com
credits to: www.tradingview.com for the trending components

SMMA Analyses - Buy / Sell signals and close position signals This script combines the usage of the SMMA indicator in order to provide signals for opening and closing trades, either buy or sell signals.
It uses two SMMA , a fast and a slow one, both configurable by the users.
The trigger of Buy and Sell Signals are calculated through the SMMA crosses:
Buy Signals : The fast SMMA crosses over the slow SMMA . They are highlighting by a green area and a "B" label.
Sell Signals : The fast SMMA crosses under the slow SMMA . They are highlighting by a red area and a "S" label
The trigger of Close Buy and Close Sell Signals are calculated through the close price crosses with the fast SMMA:
Close Buy Signals : The fast SMMA crosses under the close price and at the same time the trend is bullish , so the fast SMMA is greater than the slow SMMA . They are highlighted by a lighter green area
Close Sell Signals : The fast SMMA crosses over the close price and at the same time the trend is bearish , so the fast SMMA is lower than the slow SMMA . They are highlighted by a lighter red area
Few important points about the indicator and the produced signals :
This is not intended to be a strategy, but an indicator for analyzing the SMMA conditions. It gives you the triggers depending on the real time analysis of the SMMA and prices, but not being a proper strategy, pay attention about "fake signals" and add always a visual analysis to the provided signals
Following this indicator, the trade positions should be opened only when a cross happens. Either in this case, analyse the chart in order to see if the signals are a "weak" ones, due to "waves" around the SMMA . In these cases, you might wait for the next confirmation signals after the waves, when the trend will be better defined
The close trade signals are provided in order to help to understand when you should close the buy or sell trades. Even in this case, always add a visual analysis to the signals, and pay attention to the support/resistance areas. Sometimes, you can have the close signals in correspondence to support/resistance areas: in these cases wait for the definition of the trend and eventually for the next close trade signals if they will be better defined

Reversal Candle Pattern SetUp
An outside reversal candle set up script with buy/sell signals. Looks simple but it's pretty powerful especially if combined with your choice confirming indicator.
The pattern psychology is this one (Frank Ochoa explanation): " The power behind this pattern lies in the psychology behind the traders involved in this setup. If you have ever participated in a breakout at support or resistance only to have the market reverse sharply against you, then you are familiar with the market dynamics of this setup.
[Basically, market participants are testing the waters above resistance or below support to make sure there is no new business to be done at these levels. When no initiative buyers or sellers participate in range extension, responsive participants have all the information they need to reverse price back toward a new area of perceived value.
As you look at a bullish outside reversal pattern, you will notice that the current bar's low is lower than the
prior bar's low. Essentially, the market is testing the waters below recently established lows to see if a downside
follow-through will occur. When no additional selling pressure enters the market, the result is a flood of buying
pressure that causes a springboard effect, thereby shooting price above the prior bar's highs and creating the
beginning of a bullish advance."

ORBIT🚀 Sndey ORBIT Strategy
(ORB Intraday Tactic for Indian Markets — 5-min Compatible)
by @sndey
🔹 Overview
Sndey ORBIT is a 5-minute Opening Range Breakout (ORB) intraday strategy tailored for the Indian stock market (NSE/BSE). It captures early market momentum with synced Stoploss, Profit Target, and optional Trailing Stoploss, making it ideal for disciplined intraday traders.
🔹 Why “ORBIT”?
ORBIT stands for:
Opening
Range
Breakout
Intraday
Tactic
Like a rocket breaking past gravity, this strategy aims to catch strong price moves that escape the morning consolidation range.
🔹 How It Works
Timeframe: Optimized for 5-minute charts
ORB Range: 9:15–9:30 AM IST (first 15 mins of Indian market)
Entry:
🔼 Buy: Breakout above ORB High
🔽 Sell: Breakdown below ORB Low
Exit:
On hitting Stoploss, Target, or Trailing SL
Fully automated trade reset logic
🔹 Features
✅ Auto-calculated SL & TP based on user-defined Risk %
✅ Optional Trailing Stoploss
✅ Smart daily reset
✅ Visual plots for ORB High/Low, SL, TP
✅ Clear Buy/Sell/Exit signals
✅ Alert-ready for automation or manual execution
🔹 Notes
Designed for Indian traders (works best on NSE/BSE equities and indices like NIFTY, BANKNIFTY)
Use with liquid instruments for reliable breakout behavior
Meant for intraday use only
📌 Important
Test thoroughly using TradingView’s strategy tester and paper trading before deploying with real capital. Adjust Risk % according to your personal risk profile.
Built with precision. Traded with discipline.
Happy Trading!
– @sndey

GCM Price Boost📌 GCM Price Boost (GCMPB) – by
📈 Overview:
The GCM Price Boost indicator combines Volume Rate of Change (VROC) with a modified RSI Histogram to detect early momentum surges and potential reversal zones — giving you a powerful dual-momentum edge in all markets.
This tool is built for traders who want to spot strong price bursts (boosts) backed by volume and momentum, with visual clarity.
🔍 What It Includes:
✅ VROC Histogram:
Tracks how quickly volume is increasing alongside price.
Helps spot "pump" scenarios — surges in buying or selling pressure.
Color-coded for trend:
🟢 Green when price is rising
🔴 Red when price is falling
⚪ Gray when neutral
Two thresholds:
Small Pump (default 0.5)
Big Pump (default 10.0)
✅ RSI Histogram:
Based on RSI deviations from 50 (mid-level), scaled by a user-defined multiplier.
Color-coded histogram fill for momentum strength:
🟢 Positive = bullish pressure
🔴 Negative = bearish pressure
Histogram line color:
Above zero: 🟢 #2dff00 (bullish)
Below zero: 🔴 #ff0000 (bearish)
✅ Customizable Settings:
Adjustable VROC lookback and thresholds.
Custom RSI period and multiplier.
Amplify VROC histogram height visually via scaling multiplier.
✅ Alerts Built-in:
🔔 GCM Small Pump Detected
🔔 GCM Big Pump Detected
🔔 RSI Buy Signal
🔔 RSI Sell Signal
⚙️ Best Used For:
Spotting volume-backed momentum shifts
Surfing strong price waves (breakouts, pumps)
Timing buy/sell zones using RSI momentum
Combining with other confirmation tools (trend filters, S/R zones, etc.)
🚀 How to Use:
Add this indicator to your chart.
Watch for:
VROC bars crossing pump levels
RSI Histogram entering buy/sell zones
Use alerts to stay notified of key shifts.
Combine with price action or trend filters for higher confidence.
🧠 Pro Tip:
For aggressive traders: Enter when RSI crosses buy/sell level with a matching VROC boost.
For swing traders: Use this as an early warning of upcoming strength or exhaustion.
💬 Feedback & Upgrades:
If you’d like:
Buy/sell arrows
A strategy version for backtesting
Multi-timeframe enhancements
Drop a comment or message — I’m actively maintaining and improving this tool 💪

Smarter Money Flow Divergence Detector [PhenLabs]📊 Smarter Money Flow Divergence Detector
Version: PineScript™ v6
📌 Description
SMFD was developed to help give you guys a better ability to “read” what is going on behind the scenes without directly having access to that level of data. SMFD is an enhanced divergence detection indicator that identifies money flow patterns from advanced volume analysis and price action correspondence. The detection portion of this indicator combines intelligent money flow calculations with multi timeframe volume analysis to help you see hidden accumulation and distribution phases before major price movements occur.
The indicator measures institutional trading activity by looking at volume surges, price volume dynamics, and the factors of momentum to construct an overall picture of market sentiment. It’s built to assist traders in identifying high probability entries by identifying if smart money is positioning against price action.
🚀 Points of Innovation
● Advanced Smart Money Flow algorithm with volume spike detection and large trade weighting
● Multi timeframe volume analysis for enhanced institutional activity detection
● Dynamic overbought/oversold zones that adapt to current market conditions
● Enhanced divergence detection with pivot confirmation and strength validation
● Color themes with customizable visual styling options
● Real time institutional bias tracking through accumulation/distribution analysis
🔧 Core Components
● Smart Money Flow Calculation: Combines price momentum, volume expansion, and VWAP analysis
● Institutional Bias Oscillator: Tracks accumulation/distribution patterns with volume pressure analysis
● Enhanced Divergence Engine: Detects bullish/bearish divergences with multiple confirmation factors
● Dynamic Zone Detection: Automatically adjusts overbought/oversold levels based on market volatility
● Volume Pressure Analysis: Measures buying vs selling pressure over configurable periods
● Multi factor Signal System: Generates entries with trend alignment and strength validation
🔥 Key Features
● Smart Money Flow Period: Configurable calculation period for institutional activity detection
● Volume Spike Threshold: Adjustable multiplier for detecting unusual institutional volume
● Large Trade Weight: Emphasis factor for high volume periods in flow calculations
● Pivot Detection: Customizable lookback period for accurate divergence identification
● Signal Sensitivity: Three tier system (Conservative/Medium/Aggressive) for signal generation
● Themes: Four color schemes optimized for different chart backgrounds
🎨 Visualization
● Main Oscillator: Line, Area, or Histogram display styles with dynamic color coding
● Institutional Bias Line: Real time tracking of accumulation/distribution phases
● Dynamic Zones: Adaptive overbought/oversold boundaries with gradient fills
● Divergence Lines: Automatic drawing of bullish/bearish divergence connections
● Entry Signals: Clear BUY/SELL labels with signal strength indicators
● Information Panel: Real time statistics and status updates in customizable positions
📖 Usage Guidelines
Algorithm Settings
● Smart Money Flow Period
○ Default: 20
○ Range: 5-100
○ Description: Controls the calculation period for institutional flow analysis.
Higher values provide smoother signals but reduce responsiveness to recent activity
● Volume Spike Threshold
○ Default: 1.8
○ Range: 1.0-5.0
○ Description: Multiplier for detecting unusual volume activity indicating institutional participation. Higher values require more extreme volume for detection
● Large Trade Weight
○ Default: 2.5
○ Range: 1.5-5.0
○ Description: Weight applied to high volume periods in smart money calculations. Increases emphasis on institutional sized transactions
Divergence Detection
● Pivot Detection Period
○ Default: 12
○ Range: 5-50
○ Description: Bars to analyze for pivot high/low identification.
Affects divergence accuracy and signal frequency
● Minimum Divergence Strength
○ Default: 0.25
○ Range: 0.1-1.0
○ Description: Required price change percentage for valid divergence patterns.
Higher values filter out weaker signals
✅ Best Use Cases
● Trading with intraday to daily timeframes for institutional position identification
● Confirming trend reversals when divergences align with support/resistance levels
● Entry timing in trending markets when institutional bias supports the direction
● Risk management by avoiding trades against strong institutional positioning
● Multi timeframe analysis combining short term signals with longer term bias
⚠️ Limitations
● Requires sufficient volume for accurate institutional detection in low volume markets
● Divergence signals may have false positives during highly volatile news events
● Best performance on liquid markets with consistent institutional participation
● Lagging nature of volume based calculations may delay signal generation
● Effectiveness reduced during low participation holiday periods
💡 What Makes This Unique
● Multi Factor Analysis: Combines volume, price, and momentum for comprehensive institutional detection
● Adaptive Zones: Dynamic overbought/oversold levels that adjust to market conditions
● Volume Intelligence: Advanced algorithms identify institutional sized transactions
● Professional Visualization: Multiple display styles with customizable themes
● Confirmation System: Multiple validation layers reduce false signal generation
🔬 How It Works
1. Volume Analysis Phase:
● Analyzes current volume against historical averages to identify institutional activity
● Applies multi timeframe analysis for enhanced detection accuracy
● Calculates volume pressure through buying vs selling momentum
2. Smart Money Flow Calculation:
● Combines typical price with volume weighted analysis
● Applies institutional trade weighting for high volume periods
● Generates directional flow based on price momentum and volume expansion
3. Divergence Detection Process:
● Identifies pivot highs/lows in both price and indicator values
● Validates divergence strength against minimum threshold requirements
● Confirms signals through multiple technical factors before generation
💡 Note: This indicator works best when combined with proper risk management and position sizing. The institutional bias component helps identify market sentiment shifts, while divergence signals provide specific entry opportunities. For optimal results, use on liquid markets with consistent institutional participation and combine with additional technical analysis methods.

IU Liquidity Flow TrackerDESCRIPTION
The IU Liquidity Flow Tracker is a powerful market analysis tool designed to visualize hidden buying and selling activity by analyzing price action, volume behavior, market pressure, and depth. It provides a composite view of liquidity dynamics to help traders identify accumulation, distribution, and neutral phases with high clarity.
This indicator is ideal for traders who want to gauge the flow of market participants and make informed entry/exit decisions based on the underlying liquidity structure.
USER INPUTS:
* Flow Analysis Period: Length used for analyzing price spread and volume flow.
* Pressure Sensitivity: Adjusts the sensitivity of threshold detection for flow classification.
* Flow Smoothing: Controls the smoothing applied to raw flow data.
* Market Depth Analysis: Sets the depth range for rejection and wick analysis.
* Colors: Customize colors for accumulation, distribution, neutral zones, and pressure visualization.
INDICATOR LOGIC:
The IU Liquidity Flow Tracker uses a multi-factor model to evaluate market behavior:
1. Liquidity Pressure: Combines price spread, price efficiency, and volume imbalance.
2. Flow Direction: Weighted momentum using short, medium, and long-term price changes adjusted for volume.
3. Market Depth: Wick-based rejection scoring to estimate buying/selling aggressiveness at price extremes.
4. Composite Flow Index: Blended value of flow direction, pressure, and depth—smoothed for clarity.
5. Dynamic Thresholds: Automatically adjusts based on volatility to classify the market into:
* Accumulation: Strong buying signals.
* Distribution: Strong selling signals.
* Neutral: No significant flow dominance.
6. Entry Signals: Long/Short signals are generated when flow state shifts, supported by momentum, volume surge, and depth strength.
WHY IT IS UNIQUE:
Unlike typical indicators that rely solely on price or volume, this tool combines spread behavior, volume polarity, momentum weighting, and price rejection zones into a single visual interface. It dynamically adjusts sensitivity based on market volatility, helping avoid false signals during sideways or low-volume periods.
It is not based on any traditional indicator (RSI, MACD, etc.), making it ideal for traders looking for an original and data-driven market read.
HOW USER CAN BENEFIT FROM IT:
* Understand Market Context: Know whether the market is being accumulated, distributed, or ranging.
* Improve Entries/Exits: Use flow transitions combined with volume confirmation for high-probability setups.
* Spot Institutional Activity: Detect subtle shifts in liquidity that precede major price moves.
* Reduce Whipsaws: Dynamic thresholds and multi-factor confirmation help filter noise.
* Use with Any Style: Whether you're a swing trader, day trader, or scalper, this tool adapts to different timeframes and strategies.
DISCLAIMER:
This indicator is created for educational and informational purposes only. It does not constitute financial advice or a recommendation to buy or sell any asset. All trading involves risk, and users should conduct their own analysis or consult with a qualified financial advisor before making any trading decisions. The creator is not responsible for any losses incurred through the use of this tool. Use at your own discretion.

Information Asymmetry Gradient (IAG) What is the Information Asymmetry Gradient (IAG)?
The Information Asymmetry Gradient (IAG) is a unique market regime and imbalance detector that quantifies the subtle, directional “information flow” in price and volume. Inspired by information theory and market microstructure, IAG is designed to help traders spot the early buildup of conviction or surprise—the kind of hidden imbalance that often precedes major price moves.
Unlike traditional volume or momentum indicators, IAG focuses on the efficiency and directionality of information transfer: how much “informational energy” is being revealed by up-moves versus down-moves, normalized by price movement. It’s not just about net flow, but about the quality and asymmetry of that flow.
Theoretical Foundation
Information Asymmetry: Markets move when new information is revealed. If one side (buyers or sellers) is consistently more “informationally efficient” per unit of price change, an imbalance is building—even if price hasn’t moved much yet.
Gradient: By tracking the rate of change (gradient) between fast and slow information flows, IAG highlights when a subtle imbalance is accelerating.
Volatility of Asymmetry: Sudden spikes in the volatility of information asymmetry often signal regime uncertainty or the approach of a “surprise” move.
How IAG Works
Directional Information Content: For each bar, IAG estimates the “information per unit of price change” for both up-moves and down-moves, using volume and price action.
Asymmetry Calculation: Computes the difference (or ratio) between up and down information content, revealing directional bias.
Gradient Detection: Calculates both a fast and slow EMA of the asymmetry, then measures their difference (the “gradient”), normalized as a Z-score.
Volatility of Asymmetry: Tracks the standard deviation of asymmetry over a rolling window, with Z-score normalization to spot “information shocks.”
Flow Strength: Quantifies the conviction of the current information flow on a 0–100 scale.
Regime Detection: Flags “extreme” asymmetry, “building” flow, and “high volatility” states.
Inputs:
🌌 Core Asymmetry Parameters
Fast Information Period (short_len, default 8): EMA period for detecting immediate information flow changes.
5–8: Scalping (1–5min)
8–12: Day trading (15min–1hr)
12–20: Swing trading (4hr+)
Slow Information Period (long_len, default 34): EMA period for baseline information context. Should be 3–5x fast period.
Default (34): Fibonacci number, stable for most assets.
Gradient Smoothing (gradient_smooth, default 3): Smooths the gradient calculation.
1–2: Raw, responsive
3–5: Balanced
6–10: Very smooth
📊 Asymmetry Method
Calculation Mode (calc_mode, default "Weighted"):
“Simple”: Basic volume split by direction
“Weighted”: Volume × price movement (default, most robust)
“Logarithmic”: Log-scaled for large moves
Use Ratio (show_ratio, default false):
“Difference”: UpInfo – DownInfo (additive)
“Ratio”: UpInfo / DownInfo (multiplicative, better for comparing volatility regimes)
🌊 Volatility Analysis
Volatility Window (stdev_len, default 21): Lookback for measuring asymmetry volatility.
Volatility Alert Level (vol_threshold, default 1.5): Z-score threshold for volatility alerts.
🎨 Visual Settings
Color Theme (color_theme, default "Starry Night"):
Van Gogh-inspired palettes:
“Starry Night”: Deep blues and yellows
“Sunflowers”: Warm yellows and browns
“Café Terrace”: Night blues and warm lights
“Wheat Field”: Golden and sky blue
Show Swirl Effects (show_swirls, default true): Adds swirling background to visualize information turbulence.
Show Signal Stars (show_stars, default true): Star markers at significant asymmetry points.
Show Info Dashboard (show_dashboard, default true): Top-right panel with current metrics and market state.
Show Flow Visualization (show_flow, default true): Main gradient line with artistic effects.
Color Schemes
Dynamic color gradients adapt to both the direction and intensity of the information gradient, using Van Gogh-inspired palettes for visual clarity and artistic flair.
Glow and aura effects: The main line is layered with glows for depth and to highlight strong signals.
Swirl background: Visualizes the “turbulence” of information flow, darker and more intense as flow strength and volatility rise.
Visual Logic
Main Gradient Line: Plots the normalized information gradient (Z-score), color-coded by direction and intensity.
Glow/Aura: Multiple layers for visual depth and to highlight strong signals.
Threshold Zones: Dotted lines and filled areas mark “Building” and “Extreme” asymmetry zones.
Volatility Ribbon: Area plot of volatility Z-score, highlighting information shocks.
Signal Stars: Circular markers at each “Extreme” event, color-coded for bullish/bearish; cross markers for volatility spikes.
Dashboard: Top-right panel shows current status (Extreme, Building, High Volatility, Balanced), gradient value, flow strength, information balance, and volatility status.
Trading Guide: Bottom-left panel explains all states and how to interpret them.
How to Use IAG
🌟 EXTREME: Major information imbalance—potential for explosive move or reversal.
🌙 BUILDING: Asymmetry is forming—watch for a breakout or trend acceleration.
🌪️ HIGH VOLATILITY: Information flow is unstable—expect regime uncertainty or “surprise” moves.
☁️ BALANCED: No clear bias—market is in equilibrium.
Positive Gradient: Bullish information flow (buyers have the edge).
Negative Gradient: Bearish information flow (sellers have the edge).
Flow >66%: Strong conviction—crowd is acting in unison.
Volatility Spike: Regime uncertainty—be alert for sudden moves.
Tips:
- Use lower periods for scalping, higher for swing trading.
- “Weighted” mode is most robust for most assets.
- Combine with price action or your own system for confirmation.
- Works on all assets and timeframes—tune to your style.
Alerts
IAG Extreme Asymmetry: Extreme information asymmetry detected.
IAG Building Flow: Information flow building.
IAG High Volatility: Information volatility spike.
IAG Bullish/Bearish Extreme: Directional extreme detected.
Originality & Usefulness
IAG is not a mashup of existing indicators. It is a novel approach to quantifying the “surprise” or “conviction” element in market moves, focusing on the efficiency and directionality of information transfer per unit of price change. The multi-layered color logic, artistic visual effects, and regime dashboard are unique to this script. IAG is designed for anticipation, not confirmation—helping you see subtle imbalances before they become obvious in price.
Chart Info
Script Name: Information Asymmetry Gradient (IAG) – Starry Night
Recommended Use: Any asset, any timeframe. Tune parameters to your style.
Disclaimer
This script is for research and educational purposes only. It does not provide financial advice or direct buy/sell signals. Always use proper risk management and combine with your own strategy. Past performance is not indicative of future results.
Trade with insight. Trade with anticipation.
— Dskyz , for DAFE Trading Systems

PhenLabs - Market Fluid Dynamics📊 Market Fluid Dynamics -
Version: PineScript™ v6
📌 Description
The Market Fluid Dynamics - Phen indicator is a new thinking regarding market analysis by modeling price action, volume, and volatility using a fluid system. It attempts to offer traders control over more profound market forces, such as momentum (speed), resistance (thickness), and buying/selling pressure. By visualizing such dynamics, the script allows the traders to decide on the prevailing market flow, its power, likely continuations, and zones of calmness and chaos, and thereby allows improved decision-making.
This measure avoids the usual difficulty of reconciling multiple, often contradictory, market indications by including them within a single overarching model. It moves beyond traditional binary indicators by providing a multi-dimensional view of market behavior, employing fluid dynamic analogs to describe complex interactions in an accessible manner.
🚀 Points of Innovation
Integrated Fluid Dynamics Model: Combines velocity, viscosity, pressure, and turbulence into a single indicator.
Normalized Metrics: Uses ATR and other normalization techniques for consistent readings across different assets and timeframes.
Dynamic Flow Visualization: Main flow line changes color and intensity based on direction and strength.
Turbulence Background: Visually represents market stability with a gradient background, from calm to turbulent.
Comprehensive Dashboard: Provides an at-a-glance summary of key fluid dynamic metrics.
Multi-Layer Smoothing: Employs several layers of EMA smoothing for a clearer, more responsive main flow line.
🔧 Core Components
Velocity Component: Measures price momentum (first derivative of price), normalized by ATR. It indicates the speed and direction of price changes.
Viscosity Component: Represents market resistance to price changes, derived from ATR relative to its historical average. Higher viscosity suggests it’s harder for prices to move.
Pressure Component: Quantifies the force created by volume and price range (close - open), normalized by ATR. It reflects buying or selling pressure.
Turbulence Detection: Calculates a Reynolds number equivalent to identify market stability, ranging from laminar (stable) to turbulent (chaotic).
Main Flow Indicator: Combines the above components, applying sensitivity and smoothing, to generate a primary signal of market direction and strength.
🔥 Key Features
Advanced Smoothing Algorithm: Utilizes multiple EMA layers on the raw flow calculation for a fluid and responsive main flow line, reducing noise while maintaining sensitivity.
Gradient Flow Coloring: The main flow line dynamically changes color from light to deep blue for bullish flow and light to deep red for bearish flow, with intensity reflecting flow strength. This provides an immediate visual cue of market sentiment and momentum.
Turbulence Level Background: The chart background changes color based on calculated turbulence (from calm gray to vibrant orange), offering an intuitive understanding of market stability and potential for erratic price action.
Informative Dashboard: A customizable on-screen table displays critical metrics like Flow State, Flow Strength, Market Viscosity, Turbulence, Pressure Force, Flow Acceleration, and Flow Continuity, allowing traders to quickly assess current market conditions.
Configurable Lookback and Sensitivity: Users can adjust the base lookback period for calculations and the sensitivity of the flow to viscosity, tailoring the indicator to different trading styles and market conditions.
Alert Conditions: Pre-defined alerts for flow direction changes (positive/negative crossover of zero line) and detection of high turbulence states.
🎨 Visualization
Main Flow Line: A smoothed line plotted below the main chart, colored blue for bullish flow and red for bearish flow. The intensity of the color (light to dark) indicates the strength of the flow. This line crossing the zero line can signal a change in market direction.
Zero Line: A dotted horizontal line at the zero level, serving as a baseline to gauge whether the market flow is positive (bullish) or negative (bearish).
Turbulence Background: The indicator pane’s background color changes based on the calculated turbulence level. A calm, almost transparent gray indicates low turbulence (laminar flow), while a more vibrant, semi-transparent orange signifies high turbulence. This helps traders visually assess market stability.
Dashboard Table: An optional table displayed on the chart, showing key metrics like ‘Flow State’, ‘Flow Strength’, ‘Market Viscosity’, ‘Turbulence’, ‘Pressure Force’, ‘Flow Acceleration’, and ‘Flow Continuity’ with their current values and qualitative descriptions (e.g., ‘Bullish Flow’, ‘Laminar (Stable)’).
📖 Usage Guidelines
Setting Categories
Show Dashboard - Default: true; Range: true/false; Description: Toggles the visibility of the Market Fluid Dynamics dashboard on the chart. Enable to see key metrics at a glance.
Base Lookback Period - Default: 14; Range: 5 - (no upper limit, practical limits apply); Description: Sets the primary lookback period for core calculations like velocity, ATR, and volume SMA. Shorter periods make the indicator more sensitive to recent price action, while longer periods provide a smoother, slower signal.
Flow Sensitivity - Default: 0.5; Range: 0.1 - 1.0 (step 0.1); Description: Adjusts how much the market viscosity dampens the raw flow. A lower value means viscosity has less impact (flow is more sensitive to raw velocity/pressure), while a higher value means viscosity has a greater dampening effect.
Flow Smoothing - Default: 5; Range: 1 - 20; Description: Controls the length of the EMA smoothing applied to the main flow line. Higher values result in a smoother flow line but with more lag; lower values make it more responsive but potentially noisier.
Dashboard Position - Default: ‘Top Right’; Range: ‘Top Right’, ‘Top Left’, ‘Bottom Right’, ‘Bottom Left’, ‘Middle Right’, ‘Middle Left’; Description: Determines the placement of the dashboard on the chart.
Header Size - Default: ‘Normal’; Range: ‘Tiny’, ‘Small’, ‘Normal’, ‘Large’, ‘Huge’; Description: Sets the text size for the dashboard header.
Values Size - Default: ‘Small’; Range: ‘Tiny’, ‘Small’, ‘Normal’, ‘Large’; Description: Sets the text size for the metric values in the dashboard.
✅ Best Use Cases
Trend Identification: Identifying the dominant market flow (bullish or bearish) and its strength to trade in the direction of the prevailing trend.
Momentum Confirmation: Using the flow strength and acceleration to confirm the conviction behind price movements.
Volatility Assessment: Utilizing the turbulence metric to gauge market stability, helping to adjust position sizing or avoid choppy conditions.
Reversal Spotting: Watching for divergences between price and flow, or crossovers of the main flow line above/below the zero line, as potential reversal signals, especially when combined with changes in pressure or viscosity.
Swing Trading: Leveraging the smoothed flow line to capture medium-term market swings, entering when flow aligns with the desired trade direction and exiting when flow weakens or reverses.
Intraday Scalping: Using shorter lookback periods and higher sensitivity to identify quick shifts in flow and turbulence for short-term trading opportunities, particularly in liquid markets.
⚠️ Limitations
Lagging Nature: Like many indicators based on moving averages and lookback periods, the main flow line can lag behind rapid price changes, potentially leading to delayed signals.
Whipsaws in Ranging Markets: During periods of low volatility or sideways price action (high viscosity, low flow strength), the indicator might produce frequent buy/sell signals (whipsaws) as the flow oscillates around the zero line.
Not a Standalone System: While comprehensive, it should be used in conjunction with other forms of analysis (e.g., price action, support/resistance levels, other indicators) and not as a sole basis for trading decisions.
Subjectivity in Interpretation: While the dashboard provides quantitative values, the interpretation of “strong” flow, “high” turbulence, or “significant” acceleration can still have a subjective element depending on the trader’s strategy and risk tolerance.
💡 What Makes This Unique
Fluid Dynamics Analogy: Its core strength lies in translating complex market interactions into an intuitive fluid dynamics framework, making concepts like momentum, resistance, and pressure easier to visualize and understand.
Market View: Instead of focusing on a single aspect (like just momentum or just volatility), it integrates multiple factors (velocity, viscosity, pressure, turbulence) to provide a more comprehensive picture of market conditions.
Adaptive Visualization: The dynamic coloring of the flow line and the turbulence background provide immediate, adaptive visual feedback that changes with market conditions.
🔬 How It Works
Price Velocity Calculation: The indicator first calculates price velocity by measuring the rate of change of the closing price over a given ‘lookback’ period. The raw velocity is then normalized by the Average True Range (ATR) of the same lookback period. Normalization enables comparison of momentum between assets or timeframes by scaling for volatility. This is the direction and speed of initial price movement.
Viscosity Calculation: Market ‘viscosity’ or resistance to price movement is determined by looking at the current ATR relative to its longer-term average (SMA of ATR over lookback * 2). The further the current ATR is above its average, the lower the viscosity (less resistance to price movement), and vice-versa. The script inverts this relationship and bounds it so that rising viscosity means more resistance.
Pressure Force Measurement: A ‘pressure’ variable is calculated as a function of the ratio of current volume to its simple moving average, multiplied by the price range (close - open) and normalized by ATR. This is designed to measure the force behind price movement created by volume and intraday price thrusts. This pressure is smoothed by an EMA.
Turbulence State Evaluation: A equivalent ‘Reynolds number’ is calculated by dividing the absolute normalized velocity by the viscosity. This is the proclivity of the market to move in a chaotic or orderly fashion. This ‘reynoldsValue’ is smoothed with an EMA to get the ‘turbulenceState’, which indicates if the market is laminar (stable), transitional, or turbulent.
Main Flow Derivation: The ‘rawFlow’ is calculated by taking the normalized velocity, dampening its impact based on the ‘viscosity’ and user-input ‘sensitivity’, and orienting it by the sign of the smoothed ‘pressureSmooth’. The ‘rawFlow’ is then put through multiple layers of exponential moving average (EMA) smoothing (with ‘smoothingLength’ and derived values) to reach the final ‘mainFlow’ line. The extensive smoothing is designed to give a smooth and clear visualization of the overall market direction and magnitude.
Dashboard Metrics Compilation: Additional metrics like flow acceleration (derivative of mainFlow), and flow continuity (correlation between close and volume) are calculated. All primary components (Flow State, Strength, Viscosity, Turbulence, Pressure, Acceleration, Continuity) are then presented in a user-configurable dashboard for ease of monitoring.
💡 Note:
The “Market Fluid Dynamics - Phen” indicator is designed to offer a unique perspective on market behavior by applying principles from fluid dynamics. It’s most effective when used to understand the underlying forces driving price rather than as a direct buy/sell signal generator in isolation. Experiment with the settings, particularly the ‘Base Lookback Period’, ‘Flow Sensitivity’, and ‘Flow Smoothing’, to find what best suits your trading style and the specific asset you are analyzing. Always combine its insights with robust risk management practices.

Trailing Cumulative Volume DeltaShort Description:
A dynamic volume delta indicator that calculates a trailing sum of net buying/selling pressure over a user-defined number of recent bars, offering a more adaptive view of order flow momentum compared to fixed-anchor CVD.
Overview:
The Trailing Cumulative Volume Delta (TCVD) indicator provides a powerful way to analyze market sentiment by tracking the net difference between buying and selling volume. Unlike traditional Cumulative Volume Delta (CVD) indicators that typically reset at fixed intervals (e.g., daily, weekly), the TCVD calculates a rolling sum of volume delta over a specified number of recent bars. This "trailing" approach offers a more fluid and responsive measure of recent order flow dynamics.
How it Works:
Per-Bar Delta Calculation: For each bar on your chart, the indicator first calculates the net Volume Delta. This is done by looking at a finer, user-configurable Lower Timeframe (e.g., 1-minute data for a 15-minute chart bar) to determine the aggressive buying vs. selling volume within that bar.
Trailing Sum: The indicator then sums these individual per-bar net deltas over a user-defined Trailing Bars lookback period. For example, if "Trailing Bars" is set to 20, the TCVD value will represent the cumulative net delta of the last 20 bars.
Visualization:
The TCVD is plotted in a "MACD-Columns-Style" in a separate pane.
Teal: When the TCVD value is increasing (suggesting growing net buying pressure or diminishing net selling pressure over the trailing period).
Red: When the TCVD value is decreasing (suggesting growing net selling pressure or diminishing net buying pressure over the trailing period).
White: When it is returning to the mean.
How to Interpret and Use TCVD:
Trend Strength & Momentum:
A rising TCVD suggests that, on average over the trailing period, buying pressure is dominant or strengthening. This can confirm bullish price action or indicate underlying strength.
A falling TCVD suggests that selling pressure is dominant or strengthening, potentially confirming bearish price action or indicating weakness.
Divergences:
Unlike other Divergences, the CVD has two different types of Divergences: a) Absorption and b) Exhaustion. You only want to trade the Absorption pattern.
Zero Line Crossovers:
TCVD crossing above the zero line can indicate a shift towards net positive buying pressure over the lookback period.
TCVD crossing below the zero line can indicate a shift towards net positive selling pressure.
Confirmation: Use TCVD to confirm breakouts or breakdowns. A price breakout accompanied by a strongly rising TCVD is generally more reliable.
Key Settings:
Trailing Bars: (Default: 10)
Determines the number of recent bars to include in the cumulative delta sum.
Shorter periods make the TCVD more responsive to immediate changes.
Longer periods provide a smoother, longer-term view of order flow.
Use custom timeframe: (Checkbox, Default: false)
Allows you to override the automatic selection of the lower timeframe for delta calculation.
Timeframe for Delta Calculation: (Default: "1" - 1 minute)
Specifies the lower timeframe data used to calculate the volume delta for each individual chart bar.
Choosing a very fine timeframe (e.g., seconds) can provide high precision but may be limited by data availability or processing load.
If "Use custom timeframe" is unchecked, the script attempts to choose a sensible default based on your chart's timeframe (e.g., "1S" for second charts, "1" for intraday, "5" for daily, "60" for weekly+).
Examples:
Confirming Breakout Strength:
Price breaks out above a significant resistance level.
If the TCVD is also sharply rising and has perhaps crossed above its zero line, it provides confirmation that strong buying interest is fueling the breakout, increasing confidence in its validity.
Important Notes:
This indicator requires reliable volume data from your broker/data feed to function correctly. If your chart does not have volume, or if the volume data is unreliable, the TCVD will not be accurate.
Like all indicators, TCVD is best used as part of a comprehensive trading strategy, in conjunction with price action analysis and other indicators or tools.
Experiment with the Trailing Bars and Timeframe for Delta Calculation settings to find what best suits your trading style, the asset you are analyzing, and the chart timeframe you are using.
Feel free to modify this, add your personal touch, or include specific screenshots when you publish!

Volume candle intraday 90% valid - with alertThe candle with the highest volume of the day and that creates a new daily high or low.
- Only usable on M15 timeframes;
- You can set a range of bars (from the beginning of the day) to ignore;
- "90% valid" means a candle with volume greater than 90% of the last candle with the highest volume of the day (in the script you can change the percentage of valid volumes to define the candle volume, replacing all the "90" with the desired percentage);
- Long volumes are compared to longs and short volumes are compared to shorts;
- Script created with ChatGpt;
The psychology behind this pattern is the following: on the daily high/low, a lot of volumes will enter in a short time, either by absorption: buyers or sellers enter en masse following the trend when it is too late; or by exhaustion: buyers or sellers who entered en masse and late have no more strength to continue pushing the price, they cause a volume peak to buy/sell as much as they could, then their enemies take over forming a high/low).
Happy trading everyone! :)
###################################################################################
La candela con il volume più alto della giornata e che crea un nuovo massimo o minimo giornaliero.
- Utilizzabile solo su timeframe M15;
- Si può impostare un range di barre(da inizio giornata) da ignorare;
- "90% valida" sta per candela con volume superiore del 90% dell'ultima candela con volume più alto della giornata(nello script si può cambiare percentuale di volumi validi per definire candela volume, sostituendo tutti i "90" con la percentuale desiderata);
- I volumi long vengono confrontati con i long e i volumi short con gli short;
- Script creato con ChatGpt;
La psicologia dietro questo pattern è la seguente: sul massimo/minimo giornaliero entreranno tanti volumi in breve tempo, sia per assorbimento: buyers o sellers entrano in massa seguendo il trend quando è troppo tardi; sia per esaurimento: buyers o sellers entrati in massa e in ritardo non hanno più forza per continuare a spingere il prezzo, causano un picco volumetrico per comprare/vendere più che potevano, quindi i loro nemici prendono il sopravvento formando un massimo/minimo).
Buon trading a tutti! :)

[blackcat] L2 Trend Guard OscillatorOVERVIEW
📊 The L2 Trend Guard Oscillator is a comprehensive technical analysis framework designed specifically to identify market trend reversals using adaptive filtering algorithms that combine price action dynamics with statistical measures of volatility and momentum.
Key Purpose:
Generate reliable early warning signals before major trend changes occur
Provide clear directional bias indicators aligned with institutional investor behavior patterns
Offer risk-managed entry/exit opportunities suitable for various timeframes
TECHNICAL FOUNDATION EXPLAINED
🎓 Core Mechanism Breakdown:
→ Advanced smoothing technique emphasizing recent data points more heavily than older ones
↓ Reduces lag while maintaining signal integrity compared to traditional MA approaches
• Short-term Momentum Assessment:
🔶 Relative strength between closing prices vs lower bounds
• Long-term Directional Bias Analysis:
📈 Extended timeframe comparison generating structural context
• Defense Level Generation:
➜ Protective boundary calculation incorporating EMAs for stability enhancement
PARAMETER CONFIGURATION GUIDE
🔧 Adjustable Settings Explained In Detail:
Timeframe Selection:**
↔ Controls lookback period sensitivity affecting responsiveness
↕ Adjusts reaction speed vs accuracy trade-off dynamically
Weight Factor Specification:**
⚡ Influences emphasis on newer versus historical observations
🎯 Defines key decision-making thresholds clearly
ALGORITHM EXECUTION FLOW
💻 Processing Sequence Overview:
:
→ Gather raw pricing inputs across required periods
↓ Normalize values preparing them for subsequent processing stages
:
✔ Calculate relative strength positions against established ranges
❌ Filter outliers maintaining signal integrity consistently
⟶ Apply dual-pass filtering reducing false signals effectively
➡ Generate actionable trading opportunities systematically
VISUALIZATION ARCHITECTURE
🎨 Display Elements Designated Purpose:
🔵 Primary Indicator Traces:
→ Aqua Trace: Buy/Sell Signal Progression
↑ Red Line: Opposing Force Boundary
🟥 Gray Dashed: Zero Reference Point
🏷️ Label System For Critical Events:
✅ BUY: Bullish Opportunity Markers
❌ SELL: Bearish Setup Validations
STRATEGIC IMPLEMENTATION FRAMEWORK
📋 Practical Deployment Steps:
Initial Integration Protocol:
• Select appropriate timeframe matching strategy objectives
• Configure input parameters aligning with target asset behavior traits
• Conduct thorough backtesting under simulated environments initially
Active Monitoring Procedures:
→ Regular observation of labeled event placements versus actual movements
↓ Track confirmation patterns leading up to signaled opportunities carefully
↑ Evaluate overall framework reliability across different regime types regularly
Execution Guidelines Formulation:
✔ Enter positions only after achieving minimum number of confirming inputs
❌ Avoid isolated occurrences lacking adequate supporting evidence always
➞ Look for convergent factors strengthening conviction before acting decisively
PERFORMANCE OPTIMIZATION TECHNIQUES
🚀 Continuous Improvement Strategies:
Parameter Calibration Approach:
✓ Start testing default suggested configurations thoroughly
↕ Gradually adjust individual components observing outcome changes methodically
✨ Document findings building personalized version profile incrementally
Context Adaptability Methods:
🔄 Add supplementary indicators enhancing overall reliability when needed
🔧 Remove unnecessary complexity layers avoiding confusion/distracted decisions
💫 Incorporate custom rules adapting specific security behaviors effectively
Efficiency Improvement Tactics:
⚙️ Streamline redundant computational routines wherever possible efficiently
♻️ Leverage shared data streams minimizing resource utilization significantly
⏳ Optimize refresh frequencies balancing update speed vs overhead properly

Wyckoff Accumulation Distribution Wyckoff Accumulation & Distribution Indicator (RSI-Based)
This Pine Script is a technical analysis indicator built around the Wyckoff Method, designed to detect accumulation and distribution phases using RSI (Relative Strength Index) and pivot points. It automatically marks key structural turning points on the chart and highlights relevant zones with colored boxes.
What Does It Do?
Draws accumulation and distribution boxes based on RSI behavior.
Automatically detects Wyckoff structural signals:
SC (Selling Climax)
AR (Automatic Rally)
ST (Secondary Test)
BC (Buying Climax)
DAR (Automatic Reaction)
DST (Secondary Test - Distribution)
Identifies trend transitions by detecting sideways RSI movement.
Attempts to detect spring and UTAD-like deviations based on RSI reversals.
Uses RSI extremes in conjunction with pivot points to generate Wyckoff signals.
How Does It Work?
RSI Zone: It identifies sideways markets when RSI stays within ±20 of the 50 level (this range is configurable).
Pivot Points: It detects pivot highs/lows that sync with RSI values (pivotLen is adjustable).
Trend Box Drawing:
When RSI exits the sideways zone, the script draws a gray box between the highest high and lowest low within that range.
If RSI breaks upward, the box becomes green (Accumulation); if downward, it becomes red (Distribution).
Wyckoff Structural Points:
SC/BC: Detected when a pivot occurs with RSI below/above a threshold.
AR/DAR: The next opposite pivot after SC or BC.
ST/DST: The next same-direction pivot after AR or DAR.
How to Use It
Works best on 4H or daily charts for more reliable signals. Shorter timeframes may generate noise.
Primarily used for interpreting RSI structures through the lens of Wyckoff methodology.
Box colors help quickly identify market phase:
Green box: Likely Accumulation
Red box: Likely Distribution
Triangular markers show key signals:
SC, AR, ST: Accumulation points
BC, DAR, DST: Distribution points
Use these signals alongside price action to manually interpret Wyckoff phases.
image.binance.vision
image.binance.vision
What Is the Wyckoff Method?
The Wyckoff Method, developed in the 1930s by Richard Wyckoff, is a market analysis approach that focuses on supply and demand dynamics behind price movements.
Wyckoff’s 5 Phases:
Accumulation: Smart money gradually buying at low prices.
Markup: Price begins trending upwards.
Distribution: Smart money selling to retail traders.
Markdown: Downtrend begins as supply outweighs demand.
Re-accumulation / Re-distribution: Trend-continuation phases with consolidations.
This indicator is specifically designed to detect phase 1 (Accumulation) and phase 3 (Distribution).
Extra Notes
Repainting is minimal, as pivots are confirmed using historical candles.
Labels use plotshape for a clean, minimalist visual style.
Other Wyckoff events (like SOS, LPS, UT, UTAD) could be added in future updates.
This script does not generate buy/sell signals; it is meant for structural interpretation.
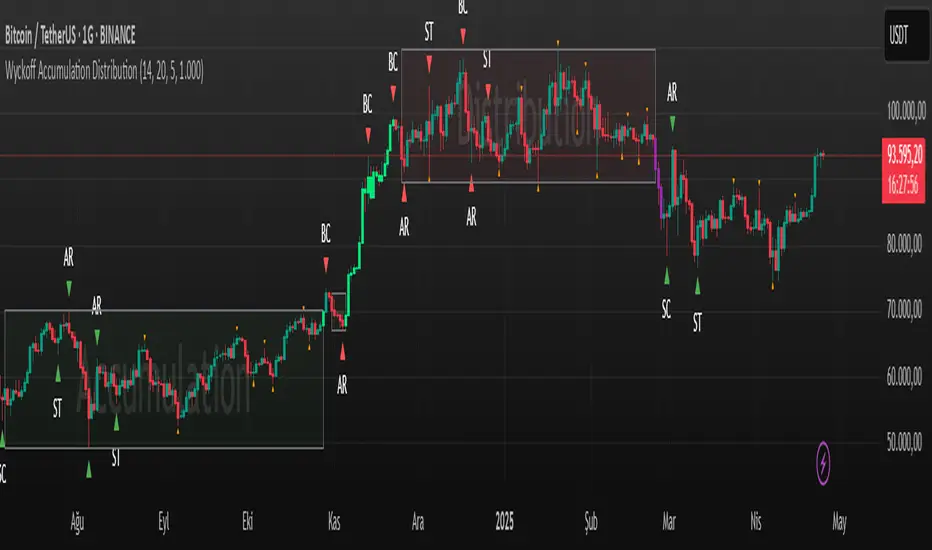
Weighted Ichimoku StrategyLSE:HSBA
The Ichimoku Kinko Hyo indicator is a comprehensive tool that combines multiple signals to identify market trends and potential buying/selling opportunities. My weighted variant of this strategy attempts to assign specific weights to each signal, allowing for a more nuanced and customizable approach to trend identification. The intent is to try and make a more informed trading decision based on the cumulative strength of various signals.
I've tried not to make it a mishmash of this and that + MACD + RSI and on and on; most people have their preferred indicator that focuses on just that that they can use in conjunction.
The signals used can be grouped into two groups the 'Core Ichimoku Signals' & the 'Additional Signals' (at the end you will find the signals and their assigned weights followed by the thresholds where they align).
The Core Ichimoku Signals are the primary signals used in Ichimoku analysis, including Kumo Breakout, Chikou Cross, Kijun Cross, Tenkan Cross, and Kumo Twist.
While the Additional Signals provide further insights and confirmations, such as Kijun Confirmation, Tenkan-Kijun Above Cloud, Chikou Above Cloud, Price-Kijun Cross, Chikou Span Signal, and Price Positioning.
Entries are triggered when the cumulative weight of bullish signals exceeds a specified buy threshold, indicating a strong uptrend or potential trend reversal.
Exits are initiated when the cumulative weight of bearish signals surpasses a specified sell threshold, or when additional conditions such as consolidation patterns or ATR-based targets are met.
There are various exit types that you can choose between, which can be used separately or in conjunction with one another. As an example you might want to exit on a different condition during consolidation periods than during other periods or just use ATR with some other backstop.
They are listed in evaluation order i.e. ATR trumps all, Consolidation exit trumps the regular Kumo sell and so on:
**ATR Sell**: Exits trades based on ATR-based profit targets and stop-losses.
**Consolidation Exit**: Exits trades during consolidation periods to reduce drawdown.
**Sell Below Kumo**: Exits trades when the price is below the Kumo, indicating a potential downtrend.
**Sell Threshold**: Exits trades when the cumulative weight of bearish signals surpasses a specified sell threshold.
There are various 'filters' which are really behavior modifiers:
**Kumo Breakout Filter**: Requires price to close above the Kumo for buy signals (essentially a entry delay).
**Whipsaw Filter**: Ensures trend strength over specified days to reduce false signals.
**Buy Cooldown**: Prevents new entries until half the Kijun period passes after an exit (prevents flapping).
**Chikou Filter**: Delays exits unless the previous close is below the Chikou Span.
**Consolidation Trend Filter**: Prevents consolidation exits if the trend is bullish (rare, but happens).
Then there are some debugging options. Ichimoku periods have some presets (personally I like 8/22/44/22) but are freely configurable, preset to the traditional values for purists.
The list of signals and most thresholds follow, play around with them. Thats all.
Cheers,
**Core Ichimoku Signals**
**Kumo Breakout**
- 30 (Bullish) / -30 (Bearish)
- Indicates a strong trend when the price breaks above (bullish) or below (bearish) the Kumo (cloud). This signal suggests a significant shift in market sentiment.
**Chikou Cross**
- 20 (Bullish) / -20 (Bearish)
- Shows the relationship between the Chikou Span (lagging span) and the current price. A bullish signal occurs when the Chikou Span is above the price, indicating a potential uptrend. Conversely, a bearish signal occurs when the Chikou Span is below the price, suggesting a downtrend.
**Kijun Cross**
- 15 (Bullish) / -15 (Bearish)
- Signals trend changes when the Tenkan-sen (conversion line) crosses above (bullish) or below (bearish) the Kijun-sen (base line). This crossover is often used to identify potential trend reversals.
**Tenkan Cross**
- 10 (Bullish) / -10 (Bearish)
- Indicates short-term trend changes when the price crosses above (bullish) or below (bearish) the Tenkan-sen. This signal helps identify minor trend shifts within the broader trend.
**Kumo Twist**
- 5 (Bullish) / -5 (Bearish)
- Shows changes in the Kumo's direction, indicating potential trend shifts. A bullish Kumo Twist occurs when Senkou Span A crosses above Senkou Span B, and a bearish twist occurs when Senkou Span A crosses below Senkou Span B.
**Additional Signals**
**Kijun Confirmation**
- 8 (Bullish) / -8 (Bearish)
- Confirms the trend based on the price's position relative to the Kijun-sen. A bullish signal occurs when the price is above the Kijun-sen, and a bearish signal occurs when the price is below it.
**Tenkan-Kijun Above Cloud**
- 5 (Bullish) / -5 (Bearish)
- Indicates a strong bullish trend when both the Tenkan-sen and Kijun-sen are above the Kumo. Conversely, a bearish signal occurs when both lines are below the Kumo.
**Chikou Above Cloud**
- 5 (Bullish) / -5 (Bearish)
- Shows the Chikou Span's position relative to the Kumo, indicating trend strength. A bullish signal occurs when the Chikou Span is above the Kumo, and a bearish signal occurs when it is below.
**Price-Kijun Cross**
- 2 (Bullish) / -2 (Bearish)
- Signals short-term trend changes when the price crosses above (bullish) or below (bearish) the Kijun-sen. This signal is similar to the Kijun Cross but focuses on the price's direct interaction with the Kijun-sen.
**Chikou Span Signal**
- 10 (Bullish) / -10 (Bearish)
- Indicates the trend based on the Chikou Span's position relative to past price highs and lows. A bullish signal occurs when the Chikou Span is above the highest high of the past period, and a bearish signal occurs when it is below the lowest low.
**Price Positioning**
- 10 (Bullish) / -10 (Bearish)
- Shows indecision when the price is between the Tenkan-sen and Kijun-sen, indicating a potential consolidation phase. A bullish signal occurs when the price is above both lines, and a bearish signal occurs when the price is below both lines.
**Confidence Level**: Highly Sensitive
- **Buy Threshold**: 50
- **Sell Threshold**: -50
- **Notes / Significance**: ~2–3 signals, very early trend detection. High sensitivity, may capture noise and false signals.
**Confidence Level**: Entry-Level
- **Buy Threshold**: 58
- **Sell Threshold**: -58
- **Notes / Significance**: ~3–4 signals, often Chikou Cross or Kumo Breakout. Very sensitive, risks noise (e.g., false buys in choppy markets).
**Confidence Level**: Entry-Level
- **Buy Threshold**: 60
- **Sell Threshold**: -60
- **Notes / Significance**: ~3–4 signals, Kumo Breakout or Chikou Cross anchors. Entry point for early trends.
**Confidence Level**: Moderate
- **Buy Threshold**: 65
- **Sell Threshold**: -65
- **Notes / Significance**: ~4–5 signals, balances sensitivity and reliability. Suitable for moderate risk tolerance.
**Confidence Level**: Conservative
- **Buy Threshold**: 70
- **Sell Threshold**: -70
- **Notes / Significance**: ~4–5 signals, emphasizes stronger confirmations. Reduces false signals but may miss some opportunities.
**Confidence Level**: Very Conservative
- **Buy Threshold**: 75
- **Sell Threshold**: -75
- **Notes / Significance**: ~5–6 signals, prioritizes high confidence. Minimizes risk but may enter trades late.
**Confidence Level**: High Confidence
- **Buy Threshold**: 80
- **Sell Threshold**: -80
- **Notes / Significance**: ~6–7 signals, very strong confirmations needed. Suitable for cautious traders.
**Confidence Level**: Very High Confidence
- **Buy Threshold**: 85
- **Sell Threshold**: -85
- **Notes / Significance**: ~7–8 signals, extremely high confidence required. Minimizes false signals significantly.
**Confidence Level**: Maximum Confidence
- **Buy Threshold**: 90
- **Sell Threshold**: -90
- **Notes / Significance**: ~8–9 signals, maximum confidence level. Ensures trades are highly reliable but may result in fewer trades.
**Confidence Level**: Ultra Conservative
- **Buy Threshold**: 100
- **Sell Threshold**: -100
- **Notes / Significance**: ~9–10 signals, ultra-high confidence. Trades are extremely reliable but opportunities are rare.
**Confidence Level**: Extreme Confidence
- **Buy Threshold**: 110
- **Sell Threshold**: -110
- **Notes / Significance**: All signals align, extreme confidence. Trades are almost certain but very few opportunities.

FeraTrading Relative Volume IndicatorThis FeraTrading Relative Volume Indicator measures relative volume pressure by comparing buying and selling activity, smoothed using a configurable average. It helps traders identify volume-driven momentum shifts, offering dynamic buy and sell signals based on weighted pressure values.
Key Features:
📈 Relative Volume (RV) Line: Measures net buying/selling pressure using volume-weighted price action.
🟢 Buy Signals: Triggered when RV crosses above a smoothed moving average (SMA 1).
🔴 Sell Signals (optional): Triggered when RV crosses below a separate SMA (SMA 2).
🔍 Customizable Inputs: Adjust smoothing length, weight, and signal sensitivity.
🕯️ Weighted Candles (optional): Visualizes custom OHLC based on volume-weighted volatility.
📊 Two SMAs: Use separate or combined moving averages to analyze trends in pressure.
🎨 Flexible Styling: Customize line and signal colors to match your chart setup.
Use Cases:
Spotting accumulation/distribution phases
Timing entries during volume surges
Confirming breakout momentum with underlying volume pressure
This indicator was developed by FeraTrading to visualize relative volume pressure.
